Annual official reports published by the Welsh Government primarily focus on exclusion instances; their yearly trends and variations by key characteristics, such as ethnicity and reason for exclusion. However, there is a need to expand this analysis by focusing on excluded individuals and the potential consequences of school exclusions on pupil outcomes. This would be a significant step towards understanding the underlying differences between the pupil-specific and school-level factors linked to school exclusions.
This blog post is part of a series presenting preliminary findings from the Excluded Lives project – a multi-disciplinary collaboration across multiple UK universities. The study employs qualitative, quantitative and policy-oriented methods to investigate school exclusions across the UK. Our analysis, carried out in the WISERD Education Data Lab, specifically explores pupil records for children in mainstream education in Wales (not accounting for pupil referral units). We identify the key individual-, school- and local authority-level characteristics of excluded pupils.
What did we do?
As outlined in the first blog post of this series, School exclusions in Wales on the rise, these analyses draw information on school exclusions recorded between the school years 2011/2012 and 2018/2019. For this blog, we studied excluded pupils separately from the total population of pupils, irrespective of length or cumulative days of exclusion. This was to minimise any potential confidentiality issues within smaller pupil sub-populations and to allow for the preliminary comparison of characteristics of excluded pupils with their peers.
What did we find?
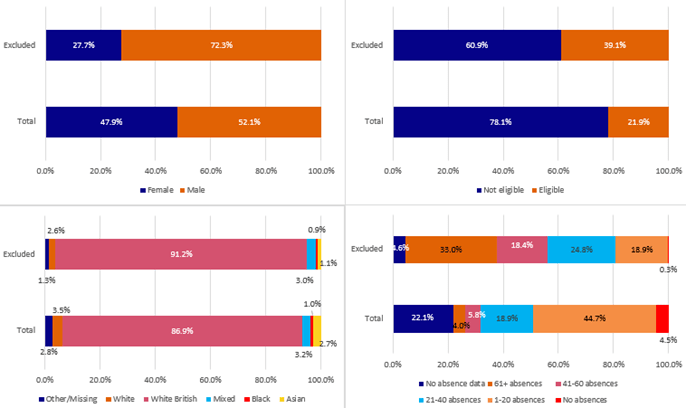
Excluded pupils differed from their peers in terms of their individual characteristics (Figure 1). Although male pupils made up half of the total pupil population, the proportion of male pupils was much higher within the excluded pupil group (20.2% higher among excluded pupils).
A greater proportion of pupils who have experienced a school exclusion were eligible for free school meals (17.2% higher among excluded pupils).
Additionally, more pupils with recorded school exclusions were of White British ethnic background (4.3% higher among excluded pupils), while the opposite was observed among those of White (Non-British) ethnic background. Interestingly, White British and White (Non-British, including Irish Traveller) pupils have been previously grouped together presenting with overall higher exclusion rates. However, there seems to be a disparity between the two groups that gets swamped due to the large number of White British pupils and the small number of Irish Traveller pupils, presenting with higher exclusion rates, in Wales.
In terms of a potential link between school exclusions and absences for reasons other than exclusion, an increase in the proportion of excluded pupils was associated with an increase in the number of recorded absences (5.9% higher among excluded pupils for 21-40 absences, 12.6% for 41-60 absences and 29% for 61+ absences), indicating that excluded pupils tend to lose more school days (due to exclusion and/or absence) than their peers.
Figure 1. Characteristics of excluded pupils compared to the whole pupil population
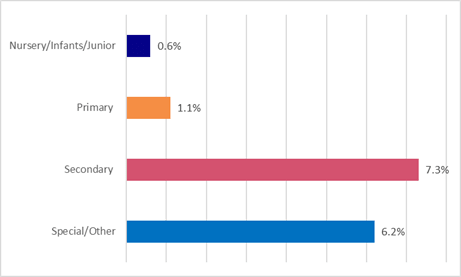
We also investigated where excluded pupils tended to be found, by school type (Figure 2) and by local authority of Wales (Figure 3). In terms of school type, the most striking proportion was observed for pupils attending a secondary school (7.3%) and special/other type of school (6.2%) while that was much lower among pupils in primary schools (1.1%). There was also a small proportion of younger pupils who have experienced exclusion (at a nursery, junior or infant level) raising some concerns about the practices leading a school exclusion at that level of education.
Figure 2. Proportion of pupils by school type
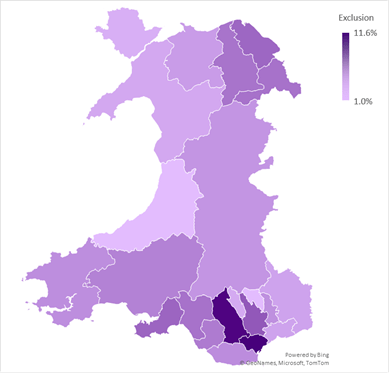
We then compared differences between rates of excluded pupils and total pupils by area of Wales. The greatest difference between excluded and total pupils was observed at South Central Wales (2% higher among excluded pupils), while a reverse effect was observed for West Wales (4.4% higher among total pupils).
However, there was a need for a more in-depth investigation, so we further explored pupil exclusion rates on a local education authority level. There was variation across local authorities with the highest rates being observed in Cardiff, Rhondda Cynon Taf and Caerphilly, reaffirming that school exclusions differ both on an individual and area level.
Figure 3. Rates of pupils per school in each local education authority
Overall, these findings on excluded pupils across Wales indicate that pupils who have been excluded from school tend to have a number of individual and school-level differences when compared to the full student body.
What do we plan to do next?
Following up on the area-level variations we observed, we’re planning to conduct additional analysis on a local education authority-level across time. Additionally, we’re interested in observing how area-level exclusion rates might be influenced by social disadvantage (indexed by free school meals) and special education needs.
About the WISERD Education Data Lab:
WISERD Education Data Lab undertakes independent analysis of administrative education data, survey data and data linkage, alongside knowledge exchange and public dissemination of findings to inform national debate on some of the most contemporary and pressing educational issues facing Wales.
WISERD Education Data Lab has received support from Administrative Data Research Wales, alongside funding from Welsh Government, Economic and Social Research Council (award: ES/012435/1) and Cardiff University.
The statistics used in this report have been approved for publication by SAIL. This does not imply Welsh Government’s acceptance of the validity of the methods used to obtain these statistics, or of any analysis of the results. Rather, they have been deemed to be non-disclosive (i.e. individual pupils cannot be identified).